|
|

|
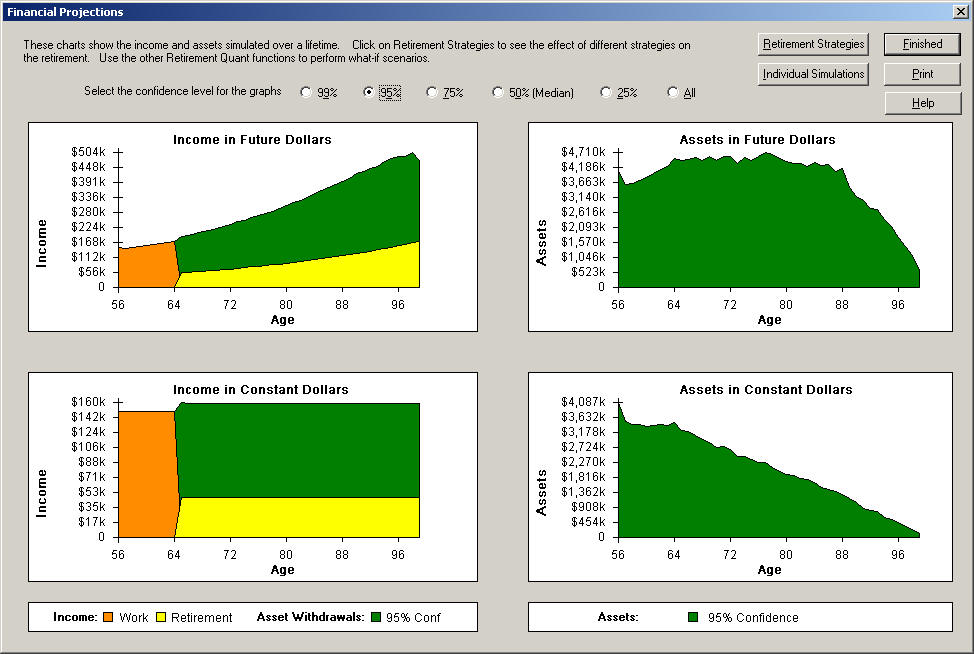
The income graphs show the sources of income in the categories of work, retirement income (annuities, pensions, and Social Security), and withdrawals from the retirement portfolio. Retirement Quant allows you to specify the confidence level of the figures. For example, a 95% confidence level means that 95% of the simulations achieved results better than that shown. At a 50% confidence, also known as the median, half of the simulations achieved results better than that shown and half had results poorer. You can quickly see the effect of changing the retirement strategy by clicking on Retirement Strategy.
|
||||||
| Approach | ||||||
| Notes | ||||||
| How it Works | ||||||
| Sample Profiles | ||||||
| In the News | ||||||
| How to Order | ||||||
| Publications | ||||||
| Management | ||||||
| FAQ | ||||||
| r | ||||||
|
© 2007 B-K-Ind LLC, All Rights Reserved |